Data Visualization Techniques for Real Estate Professionals
Data visualization is a powerful tool that enables real estate professionals to gain valuable insights from complex data sets and present them in a visually compelling format. In the ever-evolving real estate industry, data visualization techniques play a crucial role in understanding market trends, identifying investment opportunities, and effectively communicating information to clients and stakeholders. In this article, we explore various data visualization techniques that real estate professionals can employ to enhance decision-making and drive business success.

Importance of Data Visualization in Real Estate:
1. Enhanced Understanding: Data visualization transforms raw data into visual representations, making it easier for real estate professionals to grasp complex information quickly.
2. Identifying Patterns and Trends: By visualizing data, real estate professionals can identify patterns, trends, and correlations that might not be immediately apparent in tabular data.
3. Engaging Presentations: Visual presentations are more engaging and memorable, enabling real estate professionals to effectively communicate insights to clients, investors, and stakeholders.
Data Visualization Techniques for Real Estate:
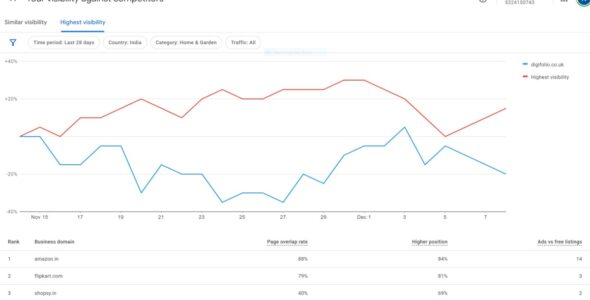
1. Interactive Charts and Graphs: Line charts, bar graphs, and scatter plots are excellent for representing trends in property prices, occupancy rates, and other market metrics. Interactive features allow users to explore data points and focus on specific time frames or regions.
2. Geospatial Heatmaps: Geospatial heatmaps visualize property prices, rental yields, or demand intensity across geographical areas. This technique helps real estate professionals identify lucrative investment spots and assess market saturation.
3. Choropleth Maps: Choropleth maps use color gradients to display data patterns across different regions, helping real estate professionals analyze demographic data, economic indicators, and property value distributions.
4. Bubble Charts: Bubble charts visualize multidimensional data by representing each data point as a bubble with varying sizes and colors. This technique is useful for comparing multiple metrics simultaneously, such as property size, price, and location.
5. 3D Data Visualization: Three-dimensional visualizations can provide a more immersive experience, especially when showcasing architectural designs or virtual property tours.
6. Infographics: Infographics combine visual elements, text, and statistics to present complex information concisely. Real estate professionals can use infographics in marketing materials or market reports.
7. Stacked Area Charts: Stacked area charts show the contribution of different variables over time, allowing real estate professionals to understand the changing composition of a market or property portfolio.

Utilizing Data Visualization Tools:
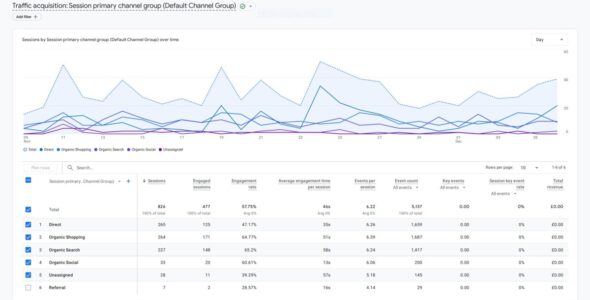
1. Tableau: Tableau is a popular data visualization tool that allows real estate professionals to create interactive dashboards and reports, enabling them to explore and analyze data easily.
2. Power BI: Microsoft Power BI is another robust data visualization platform that integrates well with other Microsoft products and offers advanced features for real-time data analysis.
3. Google Data Studio: This free tool by Google enables users to create visually appealing reports and interactive charts using data from various sources, including Google Sheets.
Best Practices for Data Visualization:
1. Simplicity: Keep visualizations simple and uncluttered, focusing on the most critical information and avoiding unnecessary distractions.
2. Consistency: Use consistent colors, fonts, and scales across different visualizations to ensure coherence and easy comprehension.
3. Contextualization: Provide context and explanations for the data presented, helping viewers interpret the information accurately.
Conclusion:
Data visualization is an indispensable tool for real estate professionals, enabling them to derive valuable insights from complex data sets and present information in a visually engaging manner. By employing various data visualization techniques and utilizing specialized tools, real estate professionals can better understand market trends, identify investment opportunities, and effectively communicate with clients and stakeholders. Following best practices in data visualization ensures that the presented information is easy to comprehend and supports informed decision-making in the dynamic real estate industry.


