1. Maximum 80A direct access
2. Standard 2 modulus width, TH35-7.5 DIN rail installation
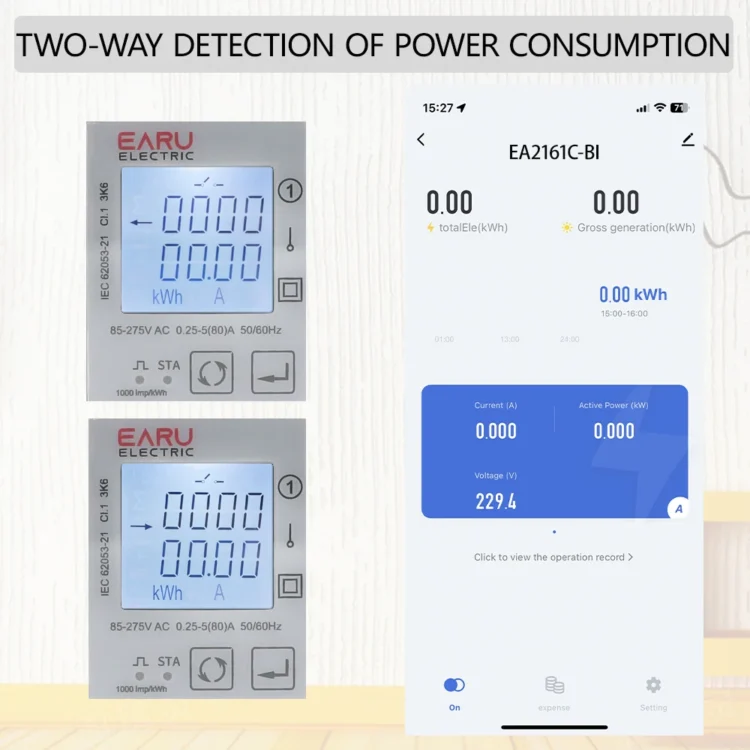
3. Support two-way electric energy and multi-rate electric energy metering, and provide monthly and daily electricity consumption statistics
4. Built-in relay, supporting remote switching, and providing relay operation records
5. Support the automatic power-off protection function of the power consumption parameter monitoring alarm (support up to two alarm monitoring)
Power Supply: 230V AC 50/60Hz
Product specification
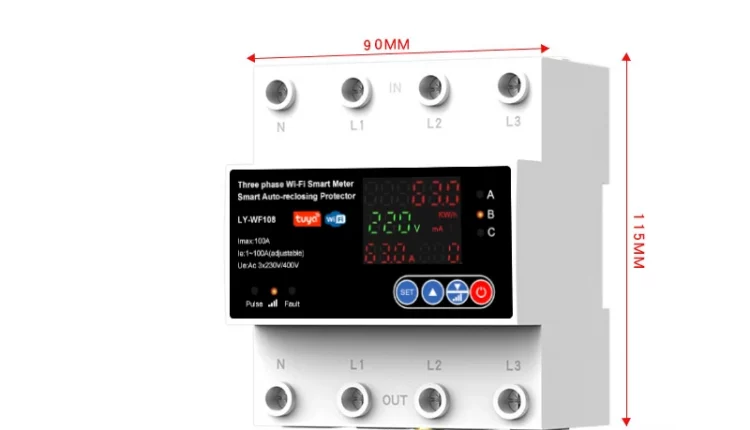
1. Over voltage protection 1V-276V (adjustable) (default: 276)
2. Over current protection 10A-80A (adjustable) (default: 10A)
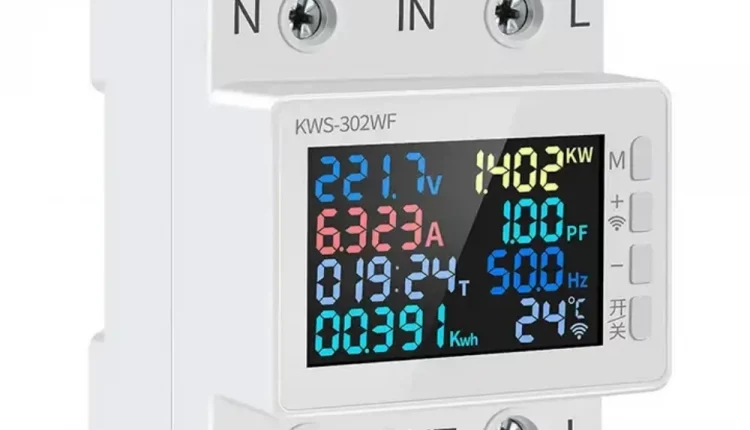
3. Voltage meter
4. Ammeter
5. Energy meter
6. Relay (ON/OFF)
7. Pulse Frequency 1000imp/kWh


.Button definition description


General function description
Multi-tariffs function
The multi-tariffs function refers to the function that the meter realizes the time-sharing measurement of electric quantity. The power meter divides the 24 hours of a day into several time periods and then specifies the rate number for each time period. Then the power meter accumulates the amount of electricity in time division according to the pre-divided time period, and stores it to the position of the rate number corresponding to each time period, to realize the function of time-division measurement of electricity.
The meter used the method of the tariff number correlation to the starting time point to realize the tariff segment division. The power meter supports up to 8 starting time points and up to 4 tariff segments (T1, T2, T3, and T4).
Figure 3-1: The starting time points of the tariff segment

As shown in Figure 3-1, 06:10 is designated as the start time of tariff 1 (T1), 12:00 is designated as the start time of tariff 2 (T2), 18:00 is designated as the start time of tariff 3 (T3), 21:00 designated as the start time of tariff 4 (T4), so tariff 1-time range is 06:10 to 12:00, tariff 2-time range is 12:00 to 18:00, tariff 3-time range is 18:00 to 21:00, tariff 4-time range is 21:00 to tomorrow 06:10.
Note: The tariff parameters can be set by communication commands (Please refer to the relevant communication protocol document for the registered address).
3.2. Definition of monthly freeze and daily freeze
The DAC2121C meter provides the statistical function of monthly and daily electricity consumption. For the time point of monthly freezing and daily freezing, the free setting operation can be realized through the Tuya APP. The meter can monitor the current time in real time, when the time reaches the set monthly freezing date, the meter will automatically freeze the monthly electricity consumption; when the time reaches the set daily freezing time, the meter will automatically freeze the daily freezing time. The definition of the freezing rule is detailed below:
3.2.1. Monthly freeze rules
The monthly freezing is set by the value of the date. When the time reaches 00:00 of the set date, the meter will freeze the current electricity quantity used and save it as the electricity consumption of the previous month. Ruling definition of month freezing date: the month frozen date is set before 15 days (including 15 days) when the frozen energy is divided into the electricity consumption of the previous month, and the date of the month freezing is set after 15 days, when the month frozen acts, the frozen energy is divided into the electricity consumption of the current month.
Example 1:
The date of monthly freezing is set to 5, assuming the current is 20:00 on July 4, then when the time reaches 00:00 on July 5, the meter will perform the freezing operation of monthly electricity consumption, dividing the frozen electricity consumption for June (00:00 on June 5 to 00:00 on July 5).
Following the above freezing rules:
Inquiry the July electricity consumption of the meter before 00:00 on July 5 will show 0, because the meter has not reached the monthly freezing date, so the accumulated energy at this time is still the electricity consumption in June.
Example 2:
The date of the monthly freeze is set to 27, assuming the current time is 20:00 on July 26, then when the time reaches 00:00 on July 27, the meter will perform the freezing operation of monthly electricity consumption, dividing the frozen electricity consumption for July (00:00 on June 27 to 00:00 July 27).
3.2.2 Daily freeze rules
The daily freezing is set by the value of the time point. When the time reaches the set time point, the meter will freeze the current electricity quantity used and save it as the electricity consumption of the previous day.
Example 1:
The time of daily freezing is set to 3, assuming the current time is 02:00 on July 5, then when the time reaches 03:00 on July 5, the meter will perform the freezing operation of daily electricity consumption, dividing the frozen electricity consumption on July 4 (03:00 on July 4 to 03:00 on July 5).
Example 2:
The time of daily freezing is set to 20, assuming the current time is 02:00 on July 5, then when the time reaches 20:00 on July 5, the meter will perform the freezing operation of daily electricity consumption, dividing the frozen electricity consumption on July 4 (20:00 on July 4 to 20:00 on July 5).
By the above freezing rules:
If you inquire about the electricity consumption on July 5 in the period between 20:00 on July 4 to 19:59 on July 5, the meter will show 0. Because the meter has not reached the daily freezing time point, the accumulated electricity consumption at this time is still the electricity consumption on July 4.
Inquiry the meter electricity consumption on July 5 at the period between 20:00 July 5 to 19:59 July 6, then the current accumulated electricity consumption value is displayed.
Auxiliary display screen
Under the main display screen, press button 1 for 3 seconds to enter the screen of the auxiliary display. At this point, click button 1 to scroll the page that needs to be viewed. Under the screen of the auxiliary display, can press button 1 for 3 seconds to return to the main display screen. If there is no button operation for more than 1 minute under the screen of the auxiliary display, the meter will automatically return to the main display screen.
 Setting-up
The logical diagram of the parameter setting menu is as follows:


 Set pulse output class parameters
Pulse output class parameters include pulse output type, pulse output rate, and pulse output width.
 Set time class parameters
Time class parameters include backlight time, automatic scroll display time, System time (RTC), and Tariff time.
 Set alarm parameters
The alarm parameters include alarm object, alarm threshold value, automatic reconnect time of relay, and alarm status.
 Manually controlled relay
Relay control: manually control the connect or disconnect action of the relay.
 Alarm
Alarm
EAC2121C series products can support the alarm function, which is associated with the inbuilt-relay of the meter. According to the real-time measurement data of the monitored object and the set alarm threshold, if the measured data exceeds the set threshold value, the instrument will automatically disconnect the relay and perform alrm prompt. The alarm function is to compare the measured data of the monitored object with the alarm threshold value every second, to judge whether the alarm threshold value is exceeded, and if it is, the alarm action will be triggered.
5.1. Alarm parameter description
1. Alarm monitoring object: the measurement parameters associated with the alarm. The meter compares the data of the measurement parameters every second to determine whether the alarm threshold is exceeded, to decide whether to trigger the alarm. The alarm monitoring object supports six measurement parameters. The specific alarm object is shown in Table 7-1 below.
2. Alarm threshold: When the measured data of the monitored object is greater than this threshold, an alarm event will be triggered.
3. Automatic reconnect time of relay: When the alarm event occurs, after the relay is disconnected, the meter will start timing processing, and when the timing time is equal to the set automatic reconnect time, the meter will automatically reconnect the relay.
Note: If the automatic reconnect time for the relay is 0, it means that the meter will not automatically reconnect after the alarm occurs, and it needs to be reconnected manually.
Alarm monitoring object

Alarm parameter setting process
Step 1: Binding the alarm monitoring object.
Step 2: Setting alarm threshold value.
Step 3: Set the automatic reconnect time of the relay.
Note: To prevent the alarm action triggered by mistake in the process of setting alarm parameters, when entering the alarm parameter setting state, the meter will automatically suspend the alarm monitoring function, and when exiting the alarm parameter setting screen, the meter will automatically start the alarm monitoring function to prevent the alarm triggered by mistake.
Alarm action process
After the alarm monitoring object is associated, the meter compares the measured data and alarm threshold value of the monitored object every second, if the measured data is greater than the alarm threshold value, the alarm event will be triggered and executed immediately the following alarm action.
Alarm action of meter:
1. Disconnect the meter inbuilt-relay.
2. The LCD will display the alarm icon: ![]()
3. Generates an SOE event and records it to memory.
Note:
1. If the alarm monitoring function of two channels is enabled at the same time, the meter will perform the alarm action when an alarm occurs in either alarm channel.
2, when the meter alarm action, if the automatic reconnect function is enabled, when the automatic reconnect time arrives, the relay will automatically reconnect, without manual intervention. If the automatic reconnect time is set to 0, the relay needs to be reconnected manually. The operation mode of manually closing the relay supports the key operation and remote communication operation.
Appendix A– LCD character definition table

Appendix B – Failure code reference table

Appendix C – Alarm prompt comparison table

Appendix D – Status indicator status table

Networking Settings (zigbee)
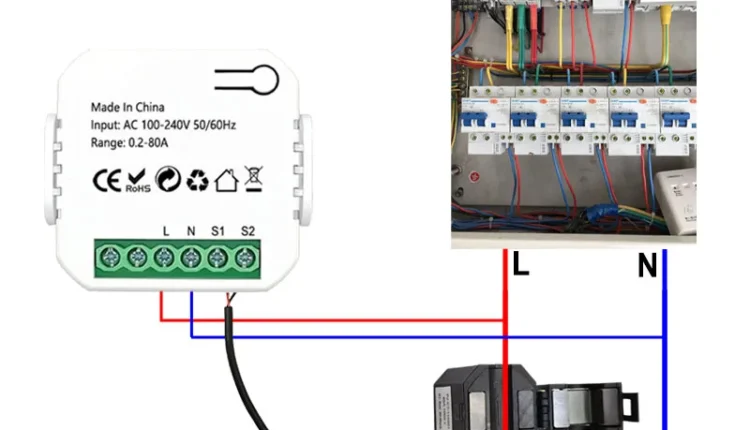
Step 1: After completing the wiring according to the wiring diagram of the meter, then power on the meter.
Step 2: First, long press the left button (button 1) for 3 seconds to enter the auxiliary interface, and then long press the right button (button 2) for 3 seconds to make the meter enter the network distribution mode.
Step 3: Open the Tuya smart APP, and click the Add Device button to select "Smart Meter (Zigbee)" in the "Energy" category
Step 4: Select a Zigbee gateway to be added as required
Step 5: First confirm that the electricity meter is in network mode(indicator light flashes quickly), and then click the "Next" button to operate according to the prompts to complete the network operation.


J***s
There is no real-time data display in the app. There is also no real-time data on consumption or network returns. On the meter screen it is in the app no. The minimum period of time in the annex is 1 hour.
V***z
The app is not very good, I would like to know much clearer at the time of the power returned to the network, but it is not very clear,
Locally on the switch if it’s a little clearer, but not in the app,
Too bad, they could improve the software
P***i
To understand xchè turns off
I***s
ok
A***n
Working fine, but it has no segregation of the generation on daily basis, monthly or yearly basis. It shows only the gross generation. Similarly it no segregation of the purchased power. Also it has the problem of not showing whether it is displaying generation or purchase. The attached figure is showing generation but one cannot understand it from the dispaly. Needs a lot of work on supplier side to do the changes in the software for these changes.
N***e
good
AliExpress Shopper
Perfect for a multi-rate count (or day/night)
Notice not necessarily complete.